Quick Debug
Debugging locally
Sometimes you'll want to use CodeLite just as a front-end to gdb: in other words, to launch and debug a binary that doesn't have a CodeLite workspace.
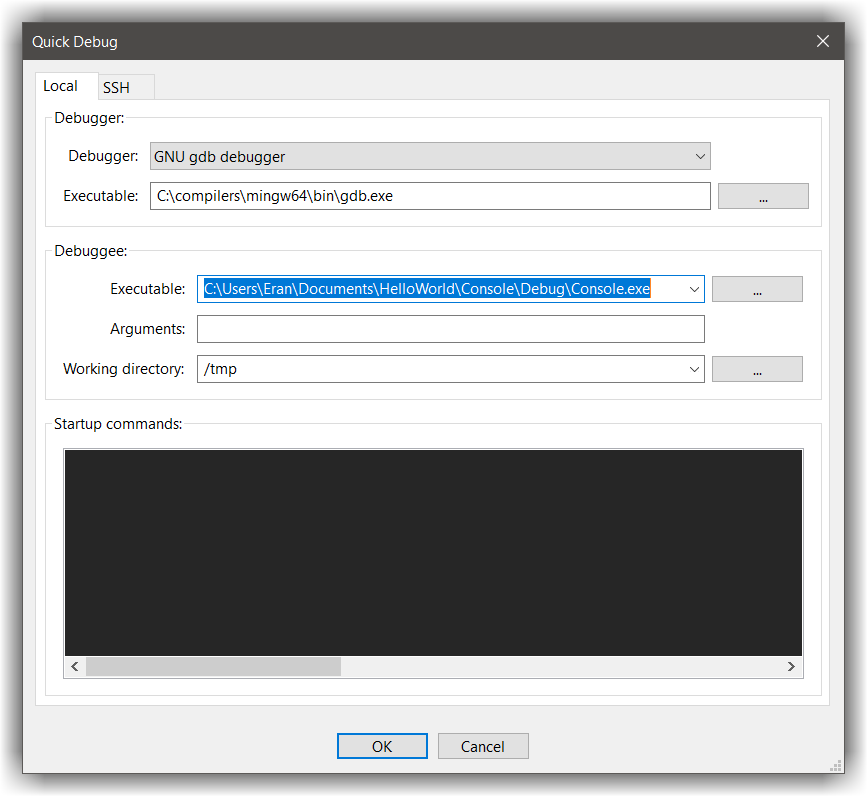
You can do this with Debug → Quick Debug. This brings up the Quick Debug dialog, which has boxes for the filepath of the binary to be debugged (essential)
and the Working Directory to which to change (less essential); and one for any arguments to pass to the program (not essential).
You can also select which debugger to use (the likely choices being gdb or none :p) and Startup Commands, where you can add commands to be passed direct to gdb.
An example is worth a thousand pictures.
Follow the steps described in the Quick Start section and build the Hello World example
this should create you Demo.exe file (assuming you are Windows)
Next,
- Open the Quick Debug dialog from
Debugger→Quick Debug - Select the
Localtab - Under
Debuggee→Executablesection, choose theDemo.exefile - Click
OK
The debugger will start, and then pause automatically at first execution line of the main function.
From here, you can interact with the debugger as described here
Remote debugging over SSH
Tip
Before continuing, please read the SFTP plugin Documentation
Tip
SSH accounts can be defined from Plugins → SFTP → Open SSH account manager
Warning
SSH accounts MUST be using ssh keys and not passwords in order to work properly
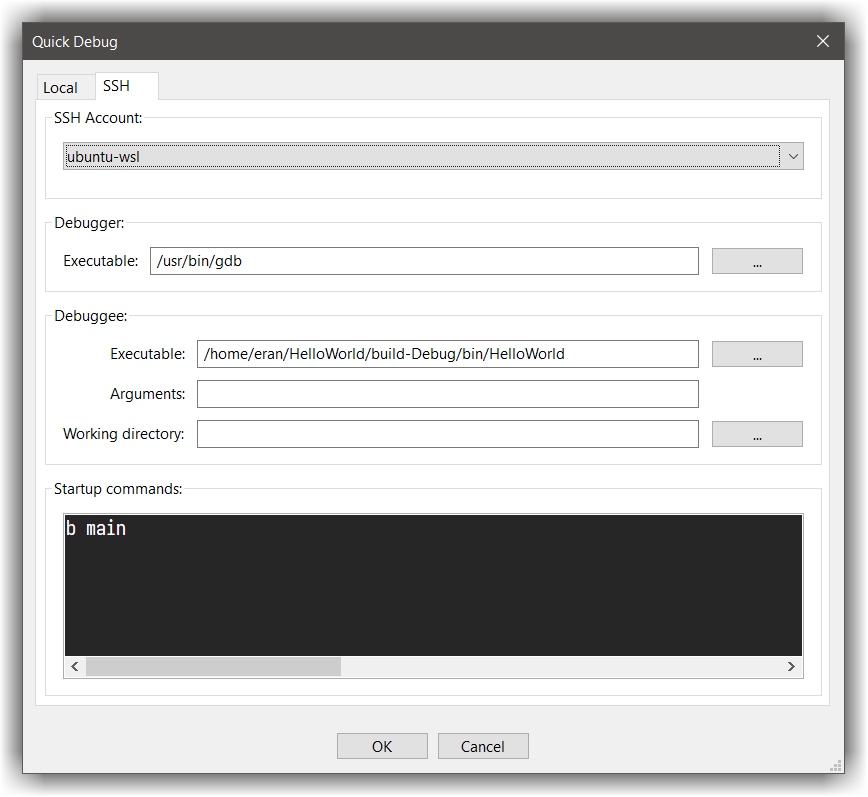
With recent versions of CodeLite it is possible to debug on a remote machine or (WSL) using the Quick Debug dialog. To enable this:
- Select the
sshtab - Under
SSH Account, select theSSHaccount you defined in CodeLite - Under the
Debugger→Executableset the path togdbon the remote machine (usually,/usr/bin/gdb) - Under the
Debuggee→Executablechoose the executable to debug on the remote machine
from here on, the process is similar to debugging local executable