XDebug (PHP)
Quick guide
- You will need an open workspace for this
- Now, configure PHP to enable XDebug debugging. From CodeLite menu bar, click on the
PHP→Run XDebug Setup Wizard - At the end of the wizard, copy the text and paste it inside your
php.inifile - Your
php.inishould also have a section similar to this:
[xdebug]
zend_extension=xdebug
xdebug.mode=debug
xdebug.start_with_request=trigger
xdebug.idekey="codeliteide"
xdebug.client_host=127.0.0.1
xdebug.client_port=9003
CodeLite supports Xdebug 3 (required by PHP 8). If you still use Xdebug 2, keep your current php.ini settings (xdebug.remote_*) and set the port in PHP → XDebug Settings... to match.
- Next, change directory to the workspace folder (in my case it was:
C:\Users\Eran\Documents\TestPHPand start PHP debug web server like this
cd C:\Users\Eran\Documents\TestPHP
php.exe -S 127.0.0.1:80 -t .
- Right click on your project folder and add new PHP file, name it
test.phpwith the following content:
<?php

$test123 = "hello world";

$arr = [];
$arr[] = "Hello";
$arr[] = "World";


function baz($i) {
    echo $i."<br>";
}

function foo($i) {
    baz($i);
}

for($i = 0; $i < 10; $i++){
    foo($i);
}
- Place a breakpoint at the
forloop (keyboard shortcut F9) - Click on the
Wait for debugger to connectbutton
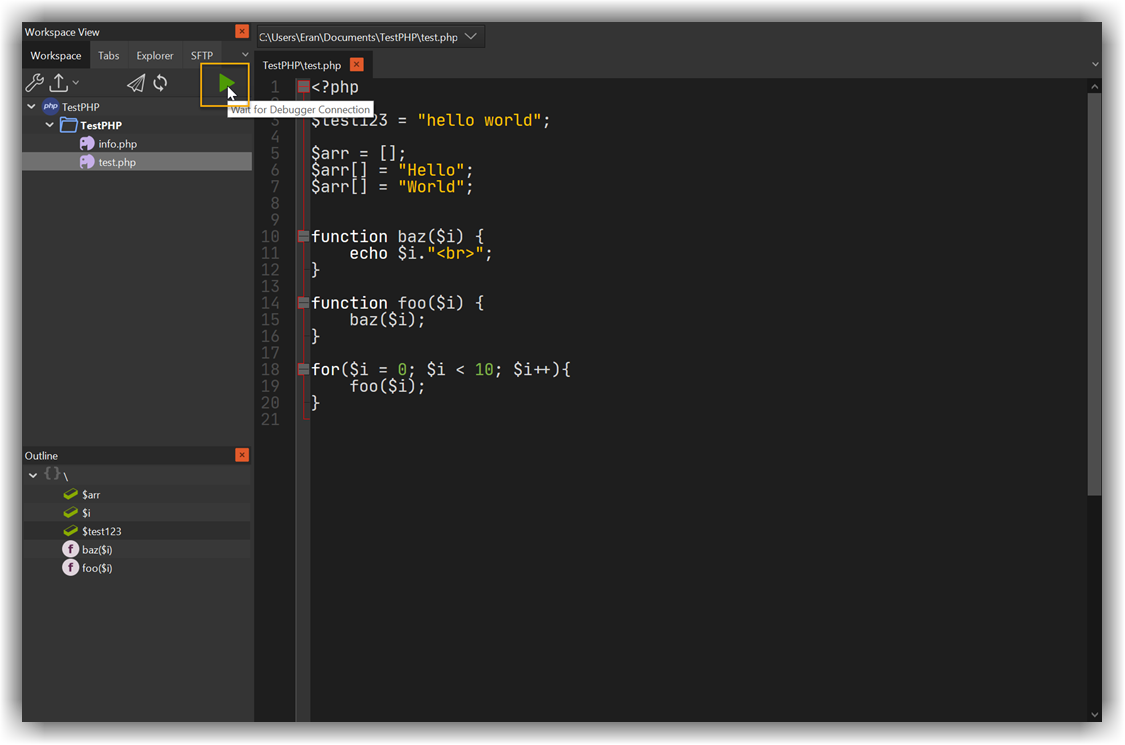
- Open a web browser and type in the address bar:
http://127.0.0.1/test.php?XDEBUG_SESSION_START=codeliteide - Clicking the
ENTERbutton in the browser, the debug session starts
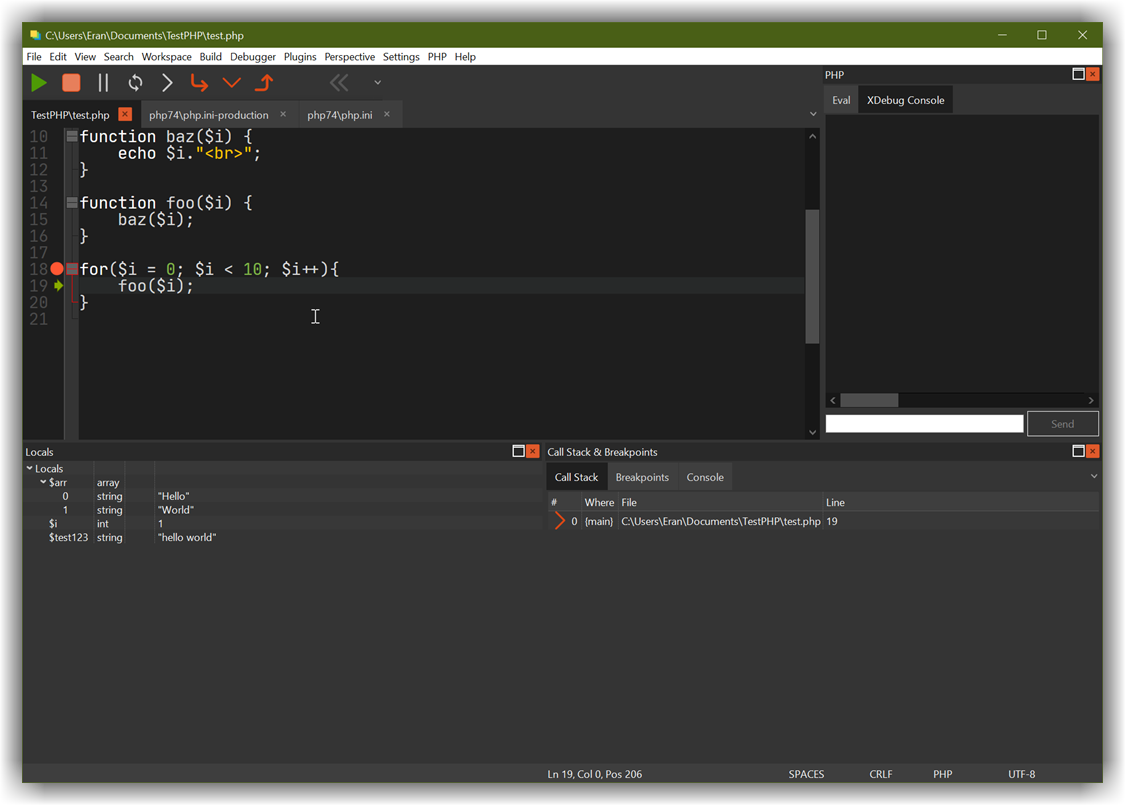
Xdebug with a File System Workspace
XDebug also works with a File System Workspace on the local machine:
- Open the workspace settings and select
XDebugas the debugger of the build configuration - From the menu bar, click on
PHP→XDebug Settings...to choose how to run the code (command line script or web site), the PHP executable, the include path and the file mapping - Start the debugger (F5). CodeLite asks for the script or URL to debug, and then starts it
- To start the session from a web browser instead, click on
PHP→Wait for XDebug to Connect, and then open the URL with?XDEBUG_SESSION_START=codeliteide
The settings and the breakpoints are stored in the file .codelite/xdebug.json in the workspace folder.